LifeCycle App
Track every asset across its complete operational life — from design and manufacturing through installation, maintenance, operations, modernisation, and eventual disposal — with cost analysis, lifespan projections, and a full event history per asset.
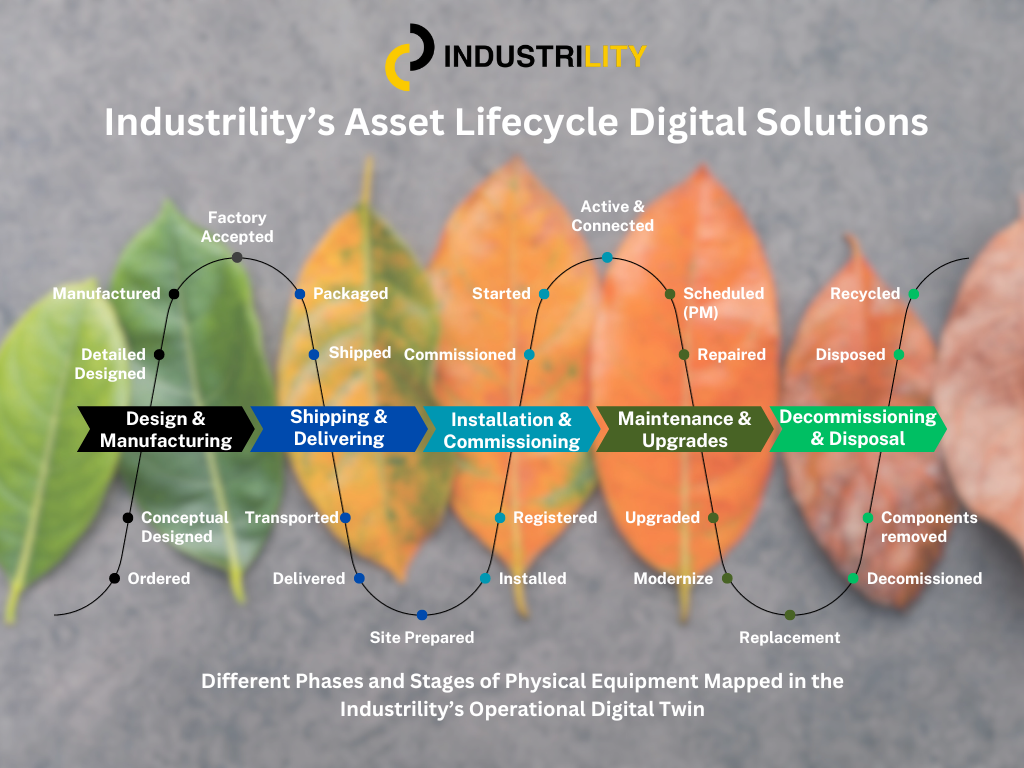
Different phases and stages of physical equipment mapped in the Industrility Operational Digital Twin.
⚙️ Configurable Phases & Stages
The lifecycle pipeline is fully configurable — you define the phases and stages that match your business. The default pipeline ships with five phases, but your administrator can customize both:
- Phases — the high-level lifecycle stages (e.g., Design & Manufacturing, Shipping & Delivering, Installation & Commissioning, Maintenance & Upgrades, Decommissioning & Disposal)
- Stages — the granular steps within each phase
Default Phases & Their Stages
| Phase | Example Stages |
|---|---|
| Design & Manufacturing | Ordered, Conceptual Designed, Detailed Designed, Manufactured, Factory Accepted |
| Shipping & Delivering | Packaged, Shipped, Transported, Delivered, Site Prepared |
| Installation & Commissioning | Registered, Installed, Commissioned, Started, Active & Connected |
| Maintenance & Upgrades | Scheduled (PM), Repaired, Upgraded, Modernize, Replacement |
| Decommissioning & Disposal | Disposed, Recycled, Components Removed, Decommissioned |
💡 Phases and stages are configured per account by your administrator via the Account Settings (
lifecyclePhasesStagesfield). Each account can have a completely different lifecycle model tailored to their equipment and industry.
💡 Assets do not automatically advance through phases — phase changes are recorded as lifecycle events. This gives you full control and an auditable history of every transition.
🖥️ Page Layout
The LifeCycle page is split into two sections side by side:
| Section | Description |
|---|---|
| Left — Installed Base | The interactive lifecycle pipeline and the Asset List below it |
| Right — Total Installed Base | Summary metrics for the full fleet including costs and warranty status |
🔁 Lifecycle Pipeline
The pipeline is the central navigation element. It shows five sequential phases as connected tiles, each displaying the count of assets currently in that phase.
| Phase | Active Color | Description |
|---|---|---|
| Installed | 🟢 Green | Asset has been commissioned and installed |
| Maintenance | 🔴 Red | Asset is undergoing or scheduled for maintenance |
| Operational | 🟢 Green | Asset is in active operational service |
| Modernisation | 🔵 Blue | Asset is being upgraded or modernised |
| Disposal | ⚫ Gray | Asset has reached end of life and is being decommissioned |
⚠️ Clicking a phase tile filters the Asset List below to show only assets in that phase. Click the same tile again to deselect and return to the full list.
⚠️ Assets do not automatically advance through phases — phase changes are recorded as lifecycle events. An asset remains in its current phase until an event moves it forward.
📊 Total Installed Base Panel
The right panel shows fleet-wide cost and warranty metrics.
Cost Summary
| Metric | Description |
|---|---|
| Total Assets | Total number of assets in the installed base |
| Installed | Total cost associated with the Installed phase |
| Maintenance | Total maintenance cost across all assets |
| Operational | Total operational cost across all assets |
| Modernisation | Total modernisation cost across all assets |
| Disposal | Total disposal cost across all assets |
Warranty Summary
| Metric | Description |
|---|---|
| Warranty Expiring (1 Month) | Assets whose warranty expires within the next 30 days |
| Warranty Expired | Assets with expired warranties |
| Under Warranty | Assets currently covered by an active warranty |
⚠️ Cost figures in this panel are cumulative across all assets — they are not filtered by the selected pipeline phase.
📋 Asset List
Below the pipeline, the Asset List shows assets filtered by the selected phase. When no phase is selected, all assets are shown.
| Column | Description |
|---|---|
| Name | Asset name �— click to open the full lifecycle detail view |
| Serial# | Asset serial number |
| LifeCycle Phase | Current lifecycle phase badge |
| LifeCycle Stage | Specific stage within the current phase (more granular) |
| TCO ($) | Total Cost of Ownership accumulated to date |
| Total Potential ($) | Projected total potential value/cost over the full lifecycle |
| Last Event Time | Date/time of the most recent lifecycle event |
Phase Badges
| Phase | Color |
|---|---|
| Installed | 🟢 Green |
| Maintenance | 🔴 Red |
| Operational | 🟢 Green |
| Modernisation | 🔵 Blue |
| Disposal | ⚫ Gray |
Stage Badges
Stage is more granular than Phase — it describes where within the phase the asset currently sits.
| Stage | When Seen |
|---|---|
| Commissioning | Assets in Installed phase being commissioned |
| Planning | Assets in early planning within a phase |
| Repaired | Assets in Maintenance that have been repaired |
| Upgraded | Assets in Modernisation that have been upgraded |
💡 Not all assets have a Stage assigned. A blank Stage cell means no stage has been logged yet.
📄 Asset Lifecycle Detail View
Click any asset name to open its full lifecycle detail page with cost analysis and event history.
Cost Summary Tiles
| Tile | Description |
|---|---|
| TCO | Lifecycle Cost (🟢) vs. Operational Cost (🔵) over time |
| TCO vs LC | Actual (🟢) vs. Expected (🔴) Total Cost of Ownership |
| CAPEX vs OPEX | Capital expenditure (🟢) vs. operational expenditure (🔵) |
| TCO Details | Breakdown of cost components |
TCO Details
| Field | Description |
|---|---|
| Total Asset Cost | Combined asset cost to date |
| Lifecycle Cost | Total lifecycle cost |
| CapEx / OpEx | Capital vs. operational expenditure |
| Energy/Fuel | Energy or fuel cost |
| Maintenance | Number of maintenance events |
| Parts | Number of parts used or replaced |
| Warranty | Number of warranty events |
| CO₂eq | Carbon equivalent metric |
Asset Lifespan
A horizontal bar showing the asset's position in its expected lifespan:
| Segment | Color | Description |
|---|---|---|
| Current Age | 🔵 Blue | How far along relative to normal life |
| Current Time | 🟠 Orange | Current point in time |
| Normal Life Expectancy | 🟢 Green | Expected end of normal operational life |
| Extended Life | 🟠 Light orange | Beyond normal expectancy |
| Metric | Description |
|---|---|
| Current Asset Age | How old the asset is (years) |
| Normal Life Expectancy | Expected normal lifespan |
| Extended Life | Maximum projected extended life |
| Remaining Life | Years of useful life remaining |
Cost Chart By Asset Phase
A horizontal bar chart showing cost breakdown across each lifecycle phase. Click any bar for detailed breakdown. Use the Select Chart Type dropdown to switch visualizations.
Asset Lifecycle Events
Every recorded lifecycle event for this asset:
| Column | Description |
|---|---|
| Event Name | Name of the lifecycle event |
| Description | What occurred |
| Event Time | Date/time recorded |
| Phase | Lifecycle phase this event belongs to |
| Stage | Stage within that phase |
| Type | Category of the event |
| Cost | Cost associated with this event |
💡 The + button adds a new event. Adding events is how phase and stage changes are recorded — this is the mechanism that moves an asset through the lifecycle pipeline.
🔄 Workflows
Workflow 1 — See All Assets in a Specific Phase
- Open LifeCycle from the sidebar
- Click the phase tile (e.g., Maintenance)
- Asset List filters to show only assets in that phase
- Review Stage column for granular detail
Workflow 2 — Check Fleet-Wide Warranty Status
- Open LifeCycle and review the Total Installed Base panel (right side)
- Check: Warranty Expiring (1 Month) → act on these first
- Check: Warranty Expired → lapsed coverage
- Check: Under Warranty → currently covered
Workflow 3 — Review an Asset's Full Cost and Lifespan
- Find the asset in the list (use search if needed) and click its name
- Review TCO tiles and TCO Details for cost breakdown
- Check Asset Lifespan bar for Remaining Life
- Review Cost Chart By Phase to see where costs are concentrated
- Scroll to Asset Lifecycle Events for full history
Workflow 4 — Record a New Lifecycle Event
- Click the asset name to open its detail view
- Scroll to Asset Lifecycle Events
- Click + in the toolbar
- Enter Event Name, Description, Phase, Stage, Type, and Cost
- Save
✅ The event is recorded, Last Event Time updates, and phase/stage badges update if the event represents a phase change.
✅ Best Practices
- Monitor Warranty Expiring (1 Month) every month — cross-reference with the Contracts app to ensure renewals are in place
- Use pipeline tiles as a triage tool — high counts in Maintenance or Modernisation signal resource demand
- Check Remaining Life before planning major repairs — if Remaining Life is very low, replacement may be more cost-effective
- Use Cost Chart By Phase to identify cost-heavy phases — a large maintenance bar signals the asset should be evaluated for modernisation or replacement
- Record events promptly — phase badges only reflect the last recorded event; late logging makes pipeline counts inaccurate
💡 Tips & Shortcuts
| Tip | How |
|---|---|
| Filter assets by phase | Click any phase tile — Asset List updates immediately |
| See all assets | Click the selected phase tile again to deselect |
| Find assets nearing end of life | Open detail view → check Remaining Life |
| See cost distribution | Open detail → Cost Chart By Phase → click any bar |
| Export the filtered list | Select a phase, then click Request Data |
| Check warranty quickly | Review the three warranty counts in the right panel |
🔗 Related Apps
- ⚙️ Assets — Full asset detail view and digital twin
- 📝 Contracts — Warranty and maintenance contracts
- 🔧 Maintenance — Maintenance plans and compliance
- 📈 Outcomes — Business intelligence reports across the installed base